Server-side analytics with Firebase Hosting
RIP Google Analytics (finally!)
Published Sep 12, 2020 • Last updated Sep 12, 2020 • 1 min read
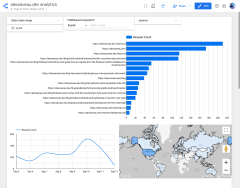
This website's custom analytics (mostly visited by bots 😜)
Client-side analytics slow down your website and are inaccurate at best, especially in communities like ours that tend to disable trackers. Until recently, Google Analytics and its equivalents were the best you could do with a static site hosted on Firebase. No more! Firebase Hosting introduced Cloud Logging to address this shortfall.
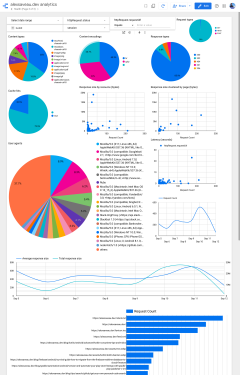
While Cloud Logging can be helpful in debugging a specific request, the magic comes when you enable exports to BigQuery. Once your data is in BigQuery, you can do whatever you want — including make the custom Data Studio dashboard pictured above. You can even go further than basic analytics and make a health dashboard:
Custom health metrics
If you’re ok with spending a few hours to set this up and design your perfect dashboard, then the rewards are well worth it. Onwards!
Enable Cloud Logging #
It’s free and just takes the click of a button. The only concern I can think of is a potential PII issue since IP addresses are logged.
Set up exports to BigQuery #
Note: sadly, this requires a billing account. Unless your site gets a crazy number of requests, it’s basically free, costing only $.01/200MBs. Interestingly enough, nothing’s actually shown up on my billing page… so maybe there’s rounding that works in our favor? Either way, $.12/year for custom analytics seems worth it to me.
- On the Cloud Logging page, hit “Create sink”
- Choose “BigQuery dataset”
- For the name, put in something like
all-traffic - For the destination, hit “Create new BigQuery dataset” and put in something like
analytics
You can make sure there were no errors by checking your activity page. If you see a bunch of BigQuery requests and no red, you’re good to go. You can now query your data! (Look for your GCP project ID in the sidebar.) For example:
SELECT
  *,
  -- Did this request come from a bot?
  NOT STARTS_WITH(httpRequest.userAgent, "Mozilla")
  OR REGEXP_CONTAINS(httpRequest.userAgent, "(?i)bot") AS is_bot,
  -- What are all the requests an IP visited over the course of a day?
  -- (Note: this is imperfect since a session crossing over midnight will be assigned
  -- two different IDs.)
  TO_HEX(MD5(CONCAT(httpRequest.remoteIp, TIMESTAMP_TRUNC(timestamp, DAY)))) AS session,
FROM
  `alexsaveau-dev.analytics.*`
Create your Data Studio dashboard #
Create a new report and choose the BigQuery connector. From there, you can choose “Custom query” and put in whatever crazy query you came up with.
Now all that’s left is to geek out making charts. Have fun!


