
DIY Gradle build optimization
The definitive guide to Gradle build performance optimization
Published Sep 05, 2018 • Last updated Jun 17, 2020 • 10 min read

Beautiful builds. Source: gradle.com
If you’re anything like me a few months ago, you’ve hit a breaking point. You’re feeling something akin to desperation and you don’t know what to do. You’ve already tried all the classic tricks like fiddling with JVM args and Gradle properties, but to no avail.
I’m going to show you how to actually improve your build performance through rigorous analysis and testing. That means I’m not going to throw random hacks at you for copypastaing — if you were hoping for a quick fix, dry up your tears and buckle up, ‘cause we’re about to get into the nitty-gritty by analysing your build to find the bottlenecks.
Gradle 101 #
For any job, I think it’s important to understand the fundamentals of your tooling. As an Android developer, the official tool is Gradle, which I feel comes with a lot of misconceptions. To start, let’s dispel some of the common ones.
What’s the difference between Android Studio and Gradle? #
This is something a lot of people struggle with: they equate Studio with Gradle. While the two tools do talk to each other (hence those annoying “Update the Gradle plugin” dialogs), they have very few similarities. One is a fancy editor, the other an automation tool.
Case in point, Gradle couldn’t care less who’s using it — heck, you could be writing code in Notepad++ (ew!) or vim (☠️) and Gradle would be none the wiser. For example, everything could be underlined in red in the IDE, but running ./gradlew assembleDebug works just fine. (That usually means you have to delete the .idea/libraries folder to force IntelliJ to refresh its indices BTW.)
At its core, Gradle primarily cares about the files it gobbles up, and those it spits out.
Tip: if you want to improve your understanding of Gradle, migrate to the Kotlin DSL using this handy guide — you’ll be able to Ctrl + B to your heart’s content.
So what’s the Android Gradle Plugin then? #
Well, Gradle on its own doesn’t actually do anything. If you don’t apply any plugins, you’ll only get built-in tasks like help, tasks, and buildEnvironment — those aren’t going to build your brilliant ideas. Wait, I figured it out! That’s the secret to getting sub-second builds: don’t actually build anything!
Jokes aside, Gradle is an automation tool, not necessarily a build tool — it merely operates on input files to generate output files. The rest is whatever you make of it: network requests, running shell scripts… anything you can do from the command line, you can do it from Gradle.
However, if you’re going to do something, Gradle needs to know what that something is — that’s where plugins come in: they configure your build. They tell Gradle what units of work, or tasks, are available for you to run.
TL;DR: plugins such as the Android Gradle Plugin (AGP) tell Gradle what tasks are available (configuration step) and you then run them (execution step).
Analysing your current build performance #
With the basics out of the way, we’re going to optimize your build scripts, plugin configuration, and task execution. Now, remember how I said this would be an involved process? Well, you’re being involved. 😁
Add the build scan plugin #
While Gradle includes the build scan plugin by default since v2.0, you’ll want to add it manually to ensure you get the latest version and don’t have to agree to the ToS every time.
Simple build scan plugin configuration
Gather basic benchmarks #
Run ./gradlew help twice and then open up the scan for the second run. Ditto for ./gradlew assembleDebug --rerun-tasks and ./gradlew assembleDebug.
Note: we’re running the build twice to get the best approximation of your real-world build performance, including any caching and other optimizations.
If you’re able to invest the extra time and effort to step up your game, benchmark your builds with the Gradle Profiler to get much more accurate results.
You now have three benchmarks:
- Configuration time
- Clean build execution time
- Incremental build execution time
These are the 3 scenarios we’re going to be optimizing, starting with configuration time.
Tip: whenever you change something, rerun the build to make sure said change had the impact you thought it did.
Project stats #
To give you a better idea of how your build should be performing compared to mine, here are the stats for my test project. (~15 modules and ~20,000 lines of Android related code as of this writing.)
General optimization #
Before getting into the specifics, let’s make sure you have the basics down:
- Latest Gradle version
- Latest AGP version
- Latest Kotlin version
- Don’t disable the Gradle Daemon
- Make sure
org.gradle.caching=truein yourgradle.propertiesfile - If possible, enable
org.gradle.paralleltoo, especially if you have multiple modules
Tip: since keeping track of the latest version of X is always a pain, I’d recommend using a version checker plugin. TBH, I’m not sure why this isn’t part of Gradle by default.
Bonus: if you’re using an age-old machine, do yourself a favor and toss it out. At the end of the day, crappy hardware equals crappy performance. The only solution there is getting a new machine.
Optimizing configuration time #
Getting back to business, you should have a build scan that looks something like this:

The Summary tab
Drilling down into the Performance tab, you’ll find all sorts of details about your build:

The Performance overview tab
If your configuration time is above 10 seconds (and you don’t have 300+ modules), something is wrong. Otherwise, as long as you’re happy with your configuration time, feel free to skip this section.
Note: 4 seconds to configure the build is actually terrible — it should only be 1–2 seconds. Unfortunately, the Kotlin plugin incorrectly resolves dependencies at configuration time.
Ready? Let’s optimize the 💩 out of that configuration time.
Cache network requests #
If you’re doing this, scroll up to find the better answer.
Check the network activity tab and make sure there were no requests:
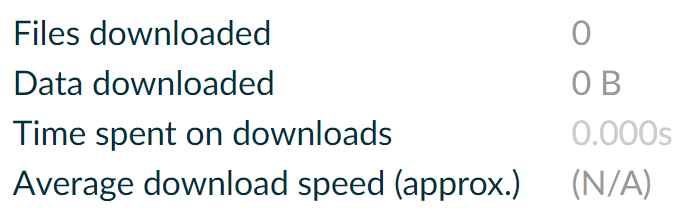
Zero is my hero
Don’t do expensive operations #
Look for bottleneck scripts dominating your configuration time. It could be file I/O, processing hashes (Git), or anything else unusually expensive. Basically, you shouldn’t ever be executing stuff at configuration time.
Aside from my slow afterEvaluate block (caused by that Kotlin bug I mentioned earlier), everything else passes the test with flying colors:
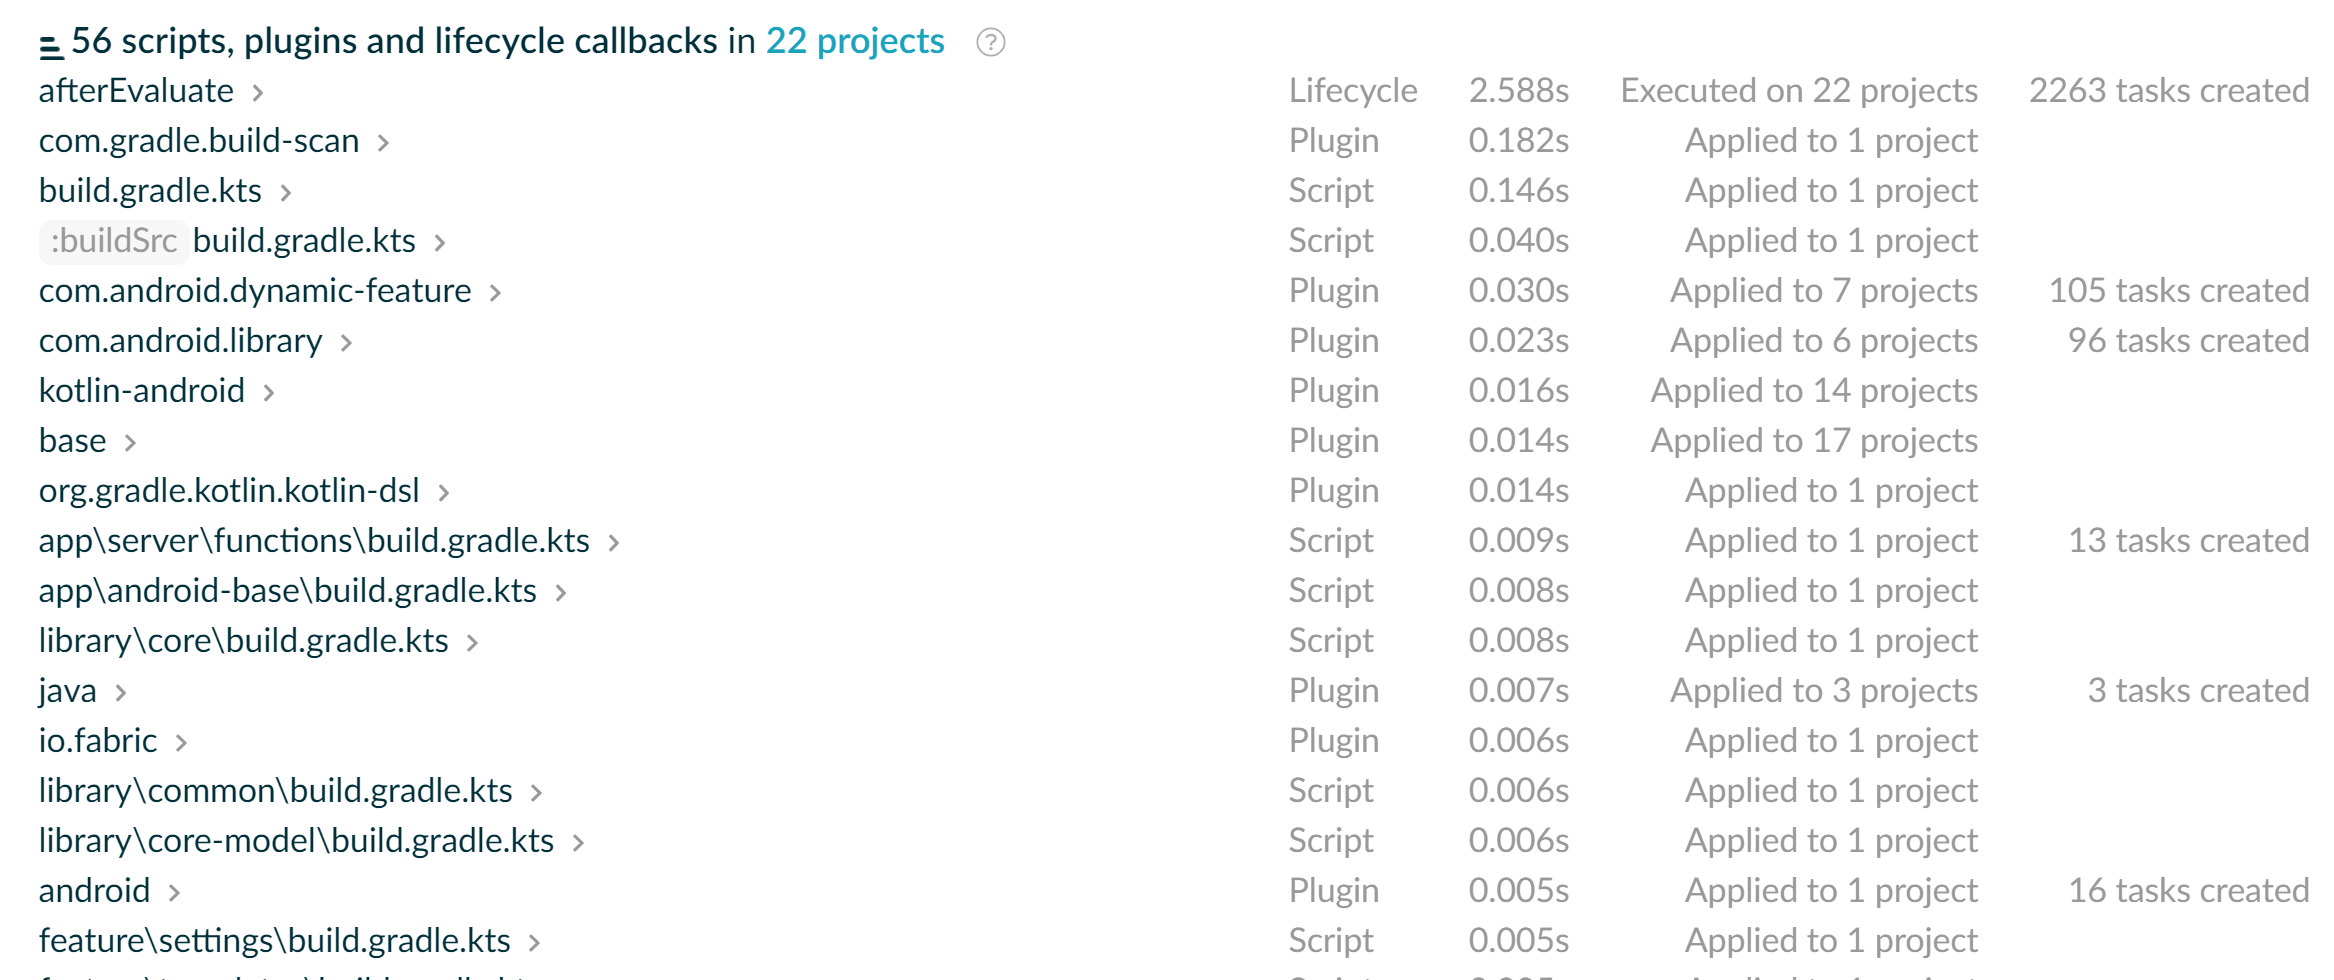
Example script configuration time
Don’t use the old task APIs #
Gradle 4.9 came out with a new API that enables task configuration avoidance. As of this writing, the AGP doesn’t yet support the new APIs, but the upgrade is targeted for v3.3 alpha 9.
In the meantime, make sure you aren’t using any of the APIs that force task configuration — those will come back to haunt you later.
Use the new task APIs #
Conversely, make sure any tasks you create in your build scripts use register instead of create (explicitly or implicitly).
Profile the build #
If you’ve found a bottleneck but can’t figure out where the problem is coming from, it’s time to profile your build. I’d recommend using JFR (you’ll need the Oracle JDK and Linux to get Flame graphs):
$ ./gradle-profiler --profile jfr --project-dir "..." help
For example, you can see how naughty the Kotlin plugin is (o.j.kotlin.g.i.AndroidSubplugin is forcing Gradle to resolve artifacts):
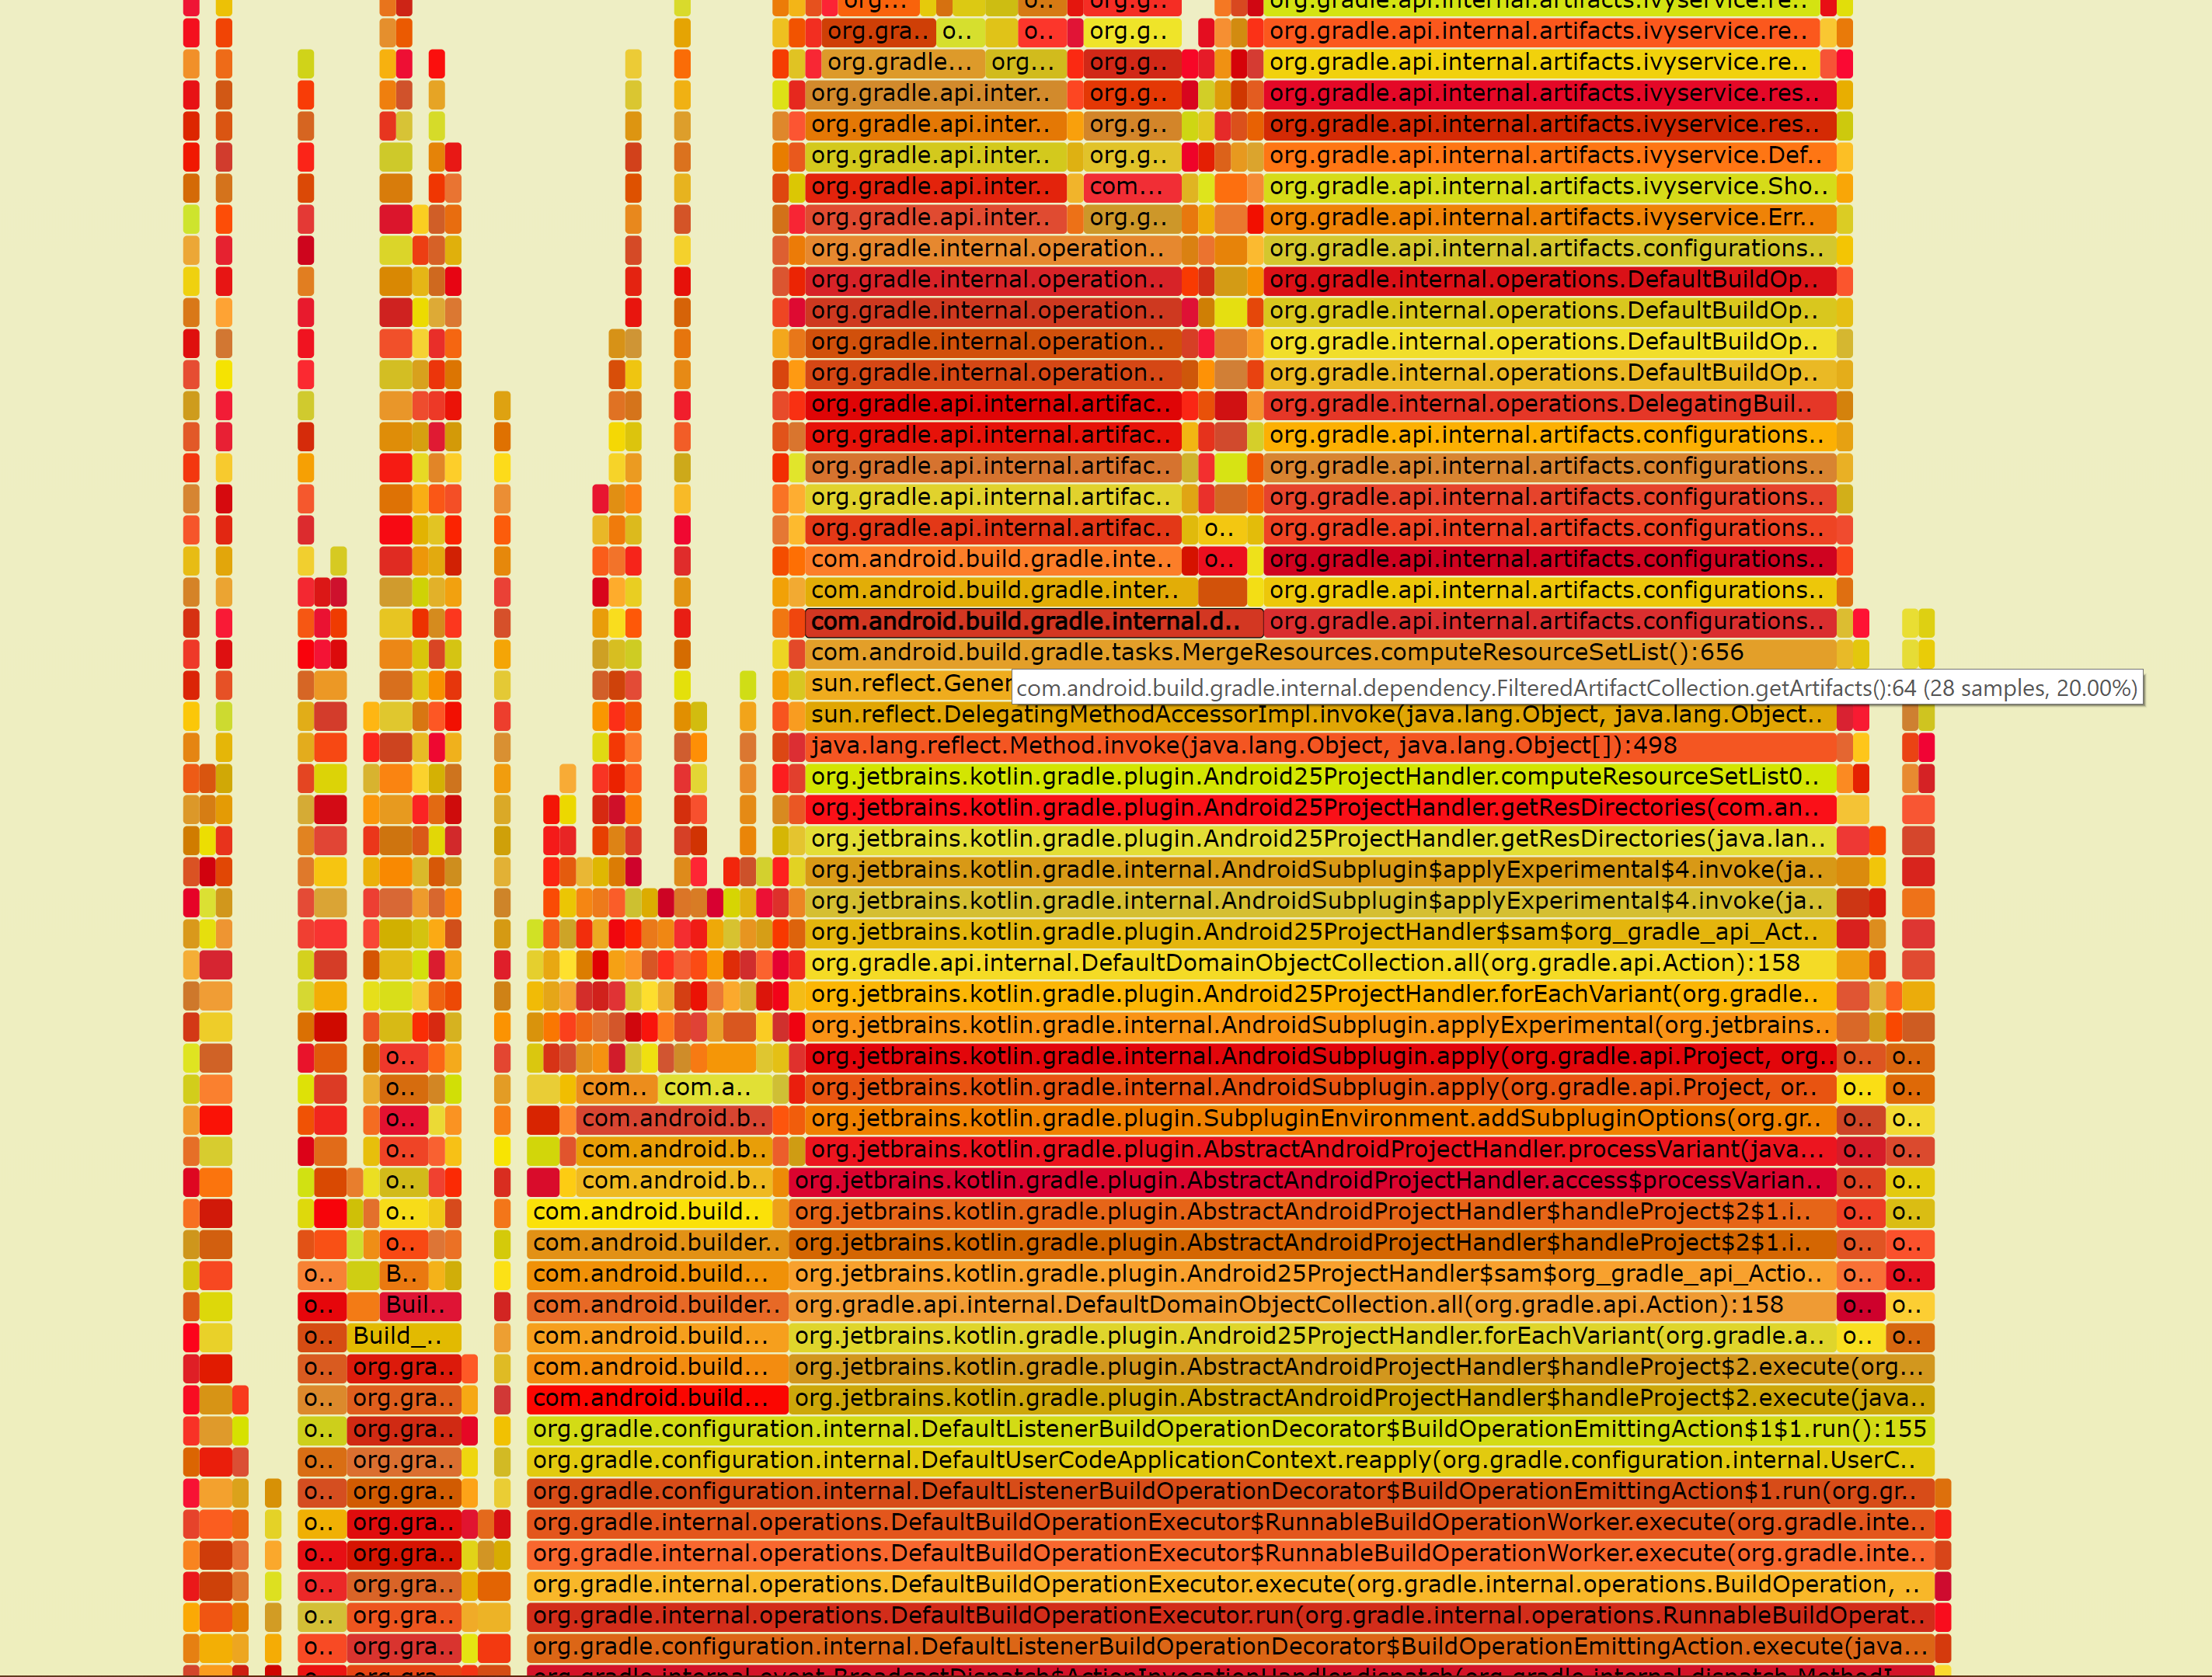
🔥
And if you can’t figure out whose fault it is but don’t think it’s yours, the Gradle team is always happy to take a look at the profiling snapshots: performance@gradle.com.
Optimizing clean build execution time #
To be fair, I haven’t really invested in this area because it doesn’t matter all that much for my day-to-day development. However, there are still a few basic steps you can take to make sure your full builds aren’t excessively slow.
Tune JVM args #
Ah yes, the classic trick every Gradle build performance article seems to mention. It turns out that unless wildly misconfigured, they don’t matter all that much.
In essence, your goal is to minimize garbage collection while also keeping your overall system healthy. So if your heap size is too small, the GC will be thrashing constantly. Too large, and you’ll start running out of system memory for other things like Chrome or IntelliJ. As Thanos said, you want it to be “perfectly balanced, as all things should be.” Minus all the killing.
Now look for “Total garbage collection time” and make sure it doesn’t account for more than 5% of your build:
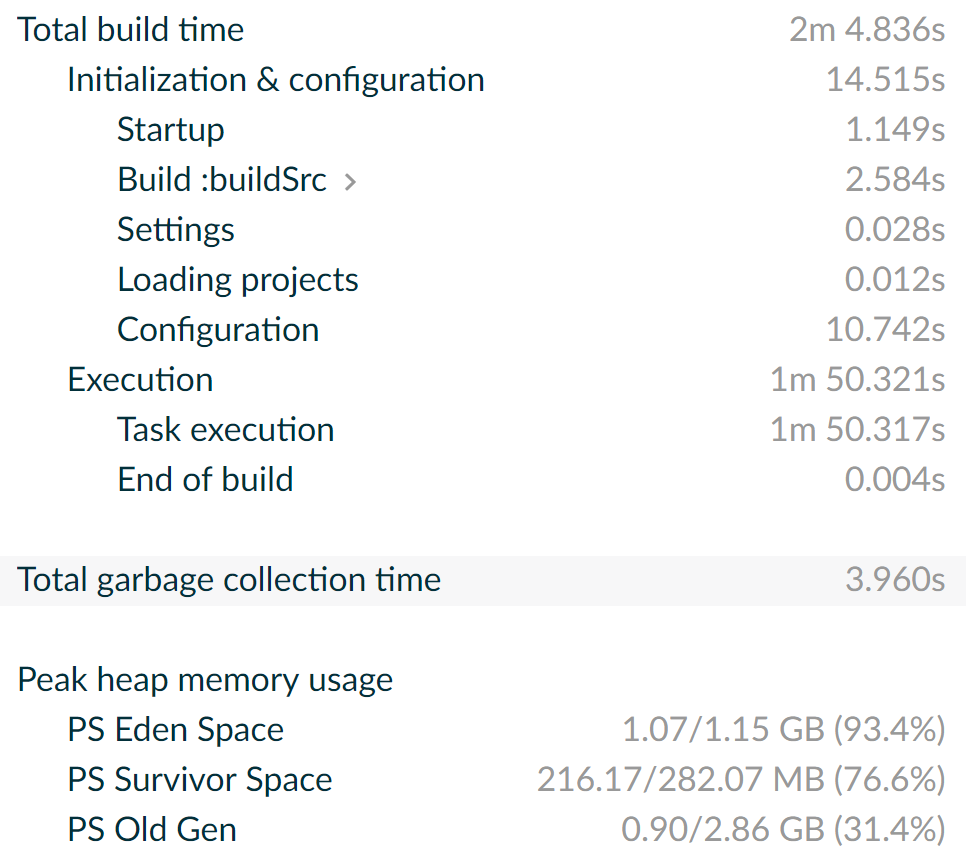
4/124 = 3.2%, looks good
If it’s anything more than that, give the Daemon another GB. Rinse & repeat.
Report excessively slow tasks to the offending parties (and disable them if possible) #
If a single task is dominating your build, something is wrong. For example, the Firebase Performance plugin is notoriously slow — something that’s painfully obvious in the timeline view:
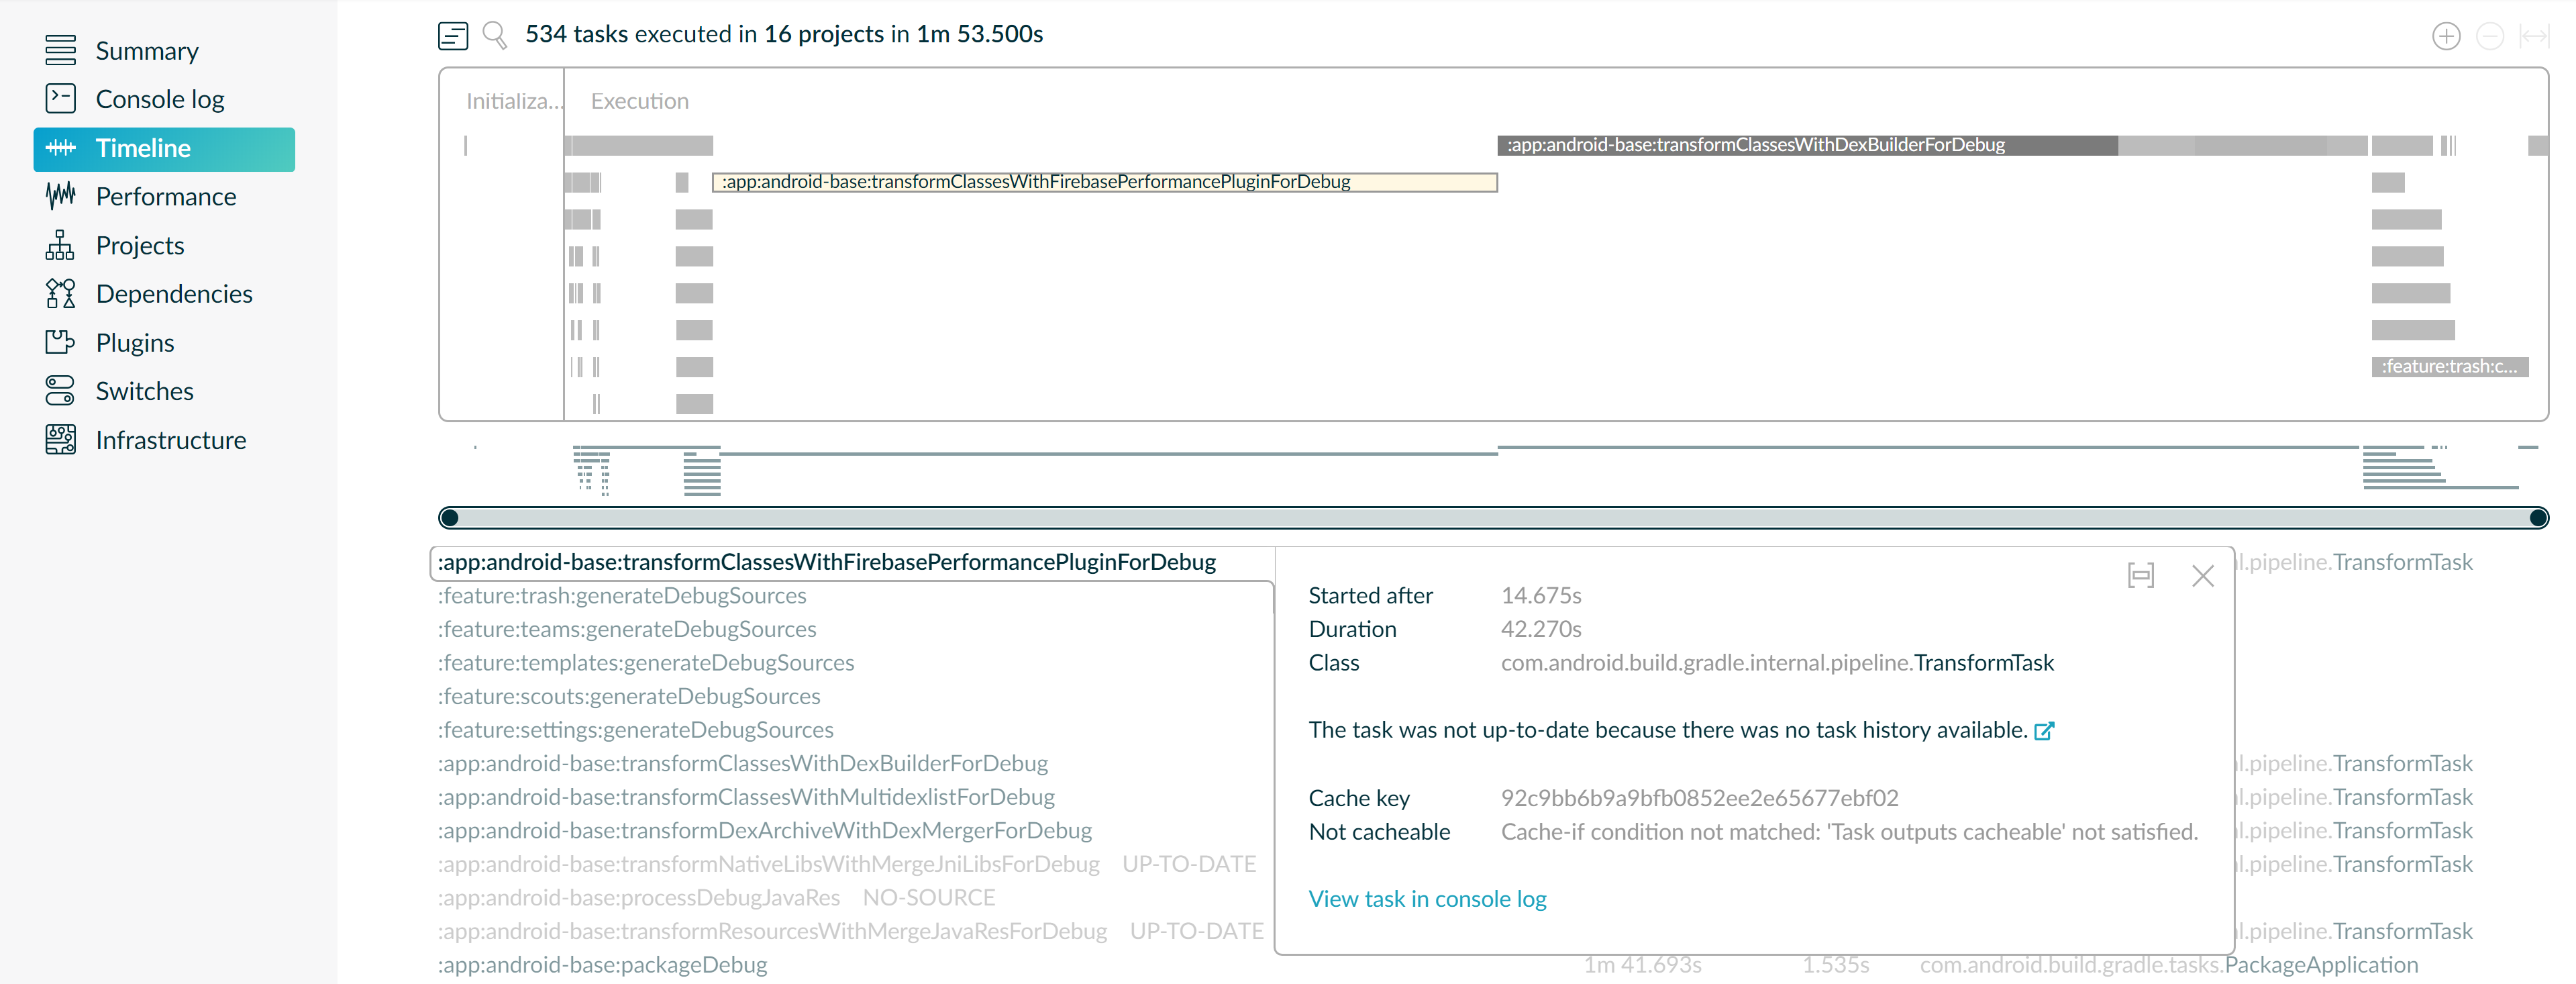
Ouch
When the task isn’t needed for your dev builds, don’t run it. You can do that by either not applying the plugin, or disabling the task itself:
Now, you’ll have an evenly spread out timeline with the longest tasks rightfully being those like compileDebugKotlin:

Balance
Here’s another example: I noticed that builds running installDebug were excessively slow because of makeApkFromBundleForDebug, so I reported it. The Studio team found multiple bugs and missed performance optimizations.
Optimizing incremental build execution time #
The importance of incremental builds is second only to configuration time. You’ll be running them dozens (if not hundreds) of times a day, so optimizing them is key.
Ensure no incremental tasks are running #
If you haven’t changed anything, nothing should happen when you rerun a build. The Studio team is doing a great job on this front, but the Play Services team sadly still hasn’t made their GoogleServicesTask incremental:
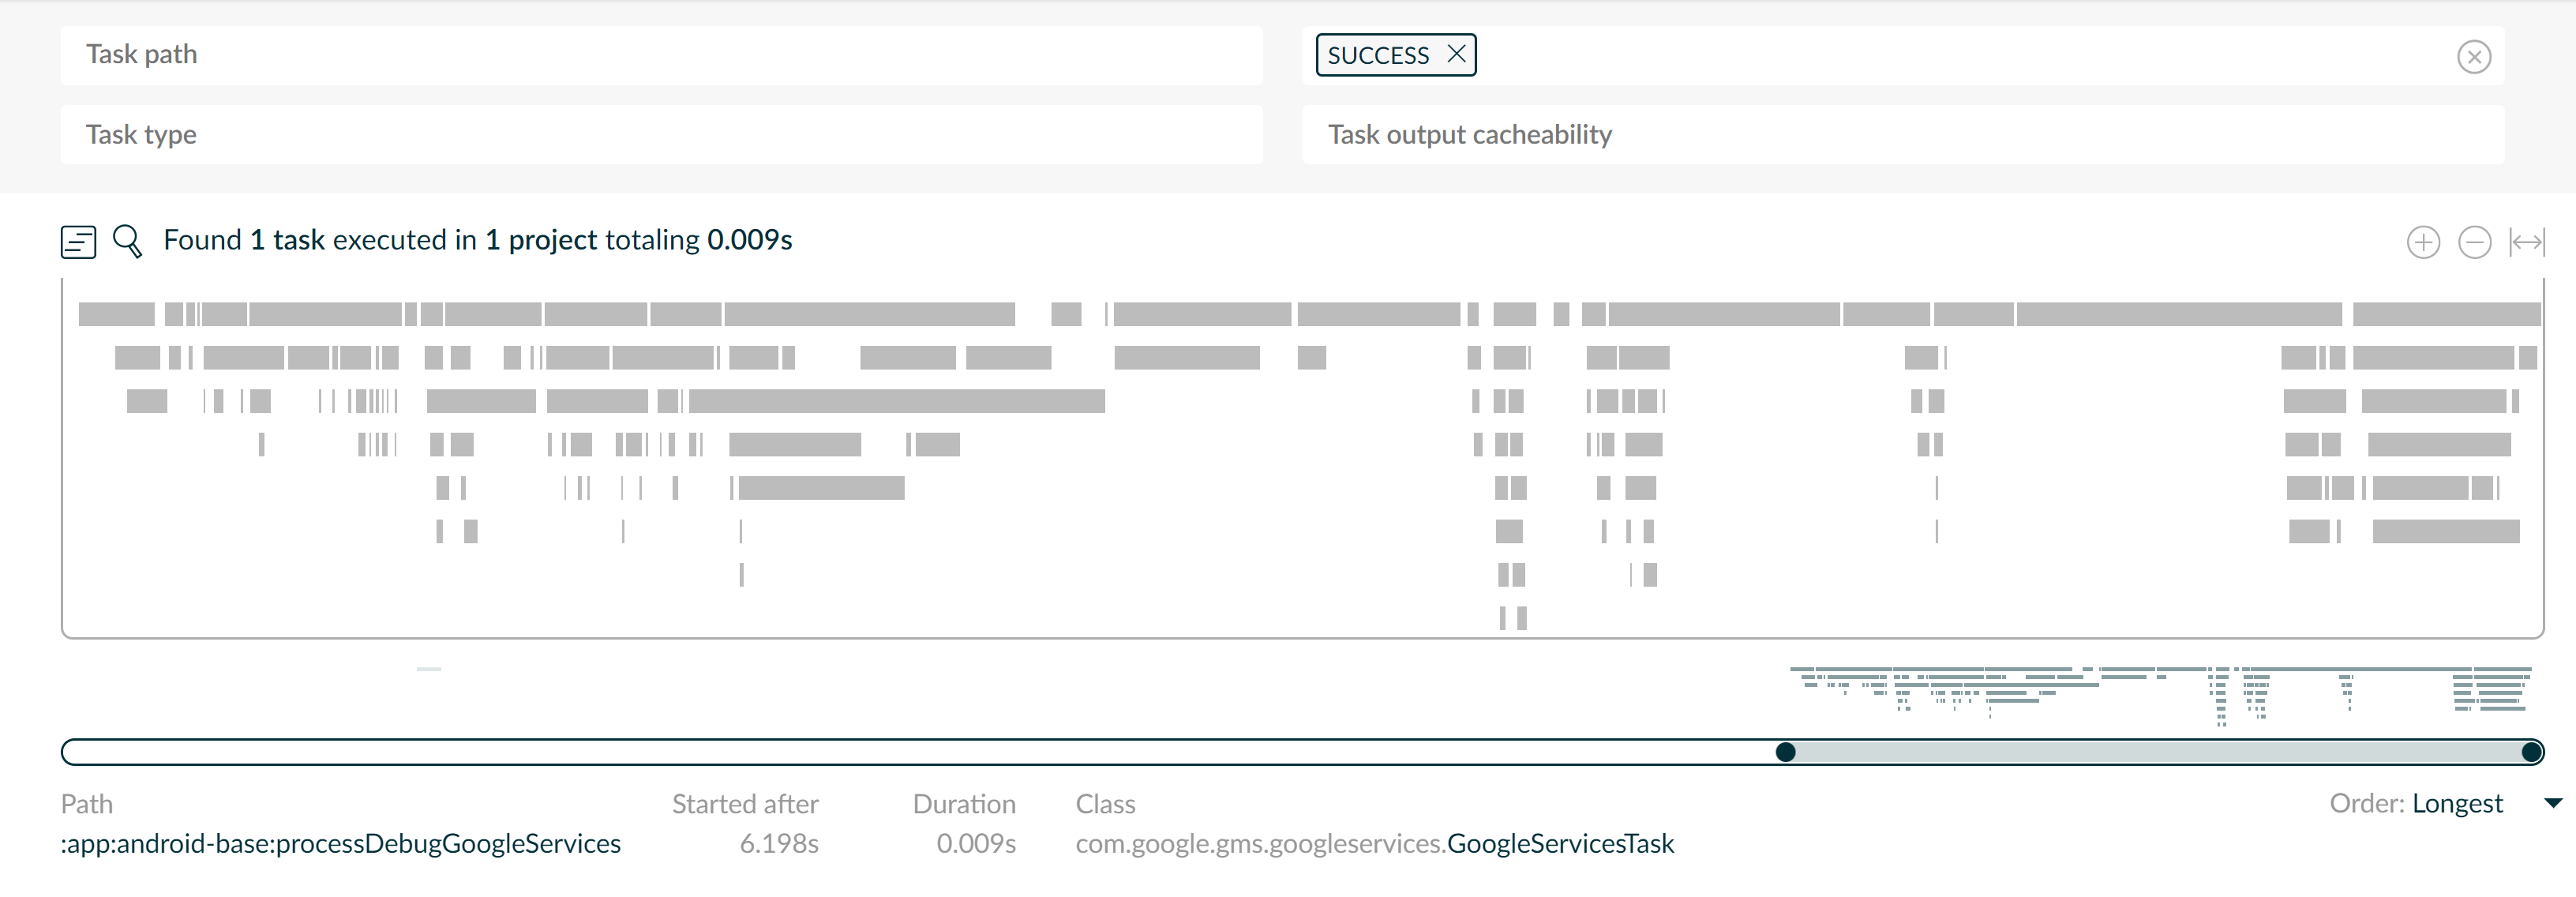
C'mon, we're sooo close!
If there are tasks you don’t think should be running, click on them to see why the cache was invalidated. You’re most likely configuring your build non-deterministically and accidentally changing inputs each time.
Minimize annotation processor use (or use incremental ones) #
Are you using Glide modules just for the prettier RequestOptions syntax? Ask yourself this: is losing incremental compilation really worth it? For me, the answer is no.
Modularize your build #
Yes, I know this one is also a tough cookie, but it’ll pay off in the end. You’ll not only improve build performance, but also code quality by enforcing clean separation of concerns between your different feature modules.
Caveat: the Kotlin plugin doesn’t yet support compilation avoidance so you won’t see huge performance benefits when editing non-leaf modules as of this writing. To be fair, this is Gradle’s fault.
Replace api dependencies with implementation wherever possible #
Once you’ve modularized your build, you’ll want to have as many leaf modules as possible. Otherwise, their children have to be recompiled whenever they change.
Next steps #
While you may have made performance gains today, that doesn’t mean you won’t mess it up again tomorrow. (That was super cynical of me, sorry 😊.) Share this article with your colleagues — make sure they aren’t accidentally breaking the rules established throughout the guide.
I’d also recommend taking advantage of the Gradle Enterprise free trial to collect a few weeks worth of data and make sure everyone on your team is getting the best possible performance.
Well, that’s a wrap. I hope I’ve given you the tools to fight back growing build times and maximize your productivity.